

|
|
|
|
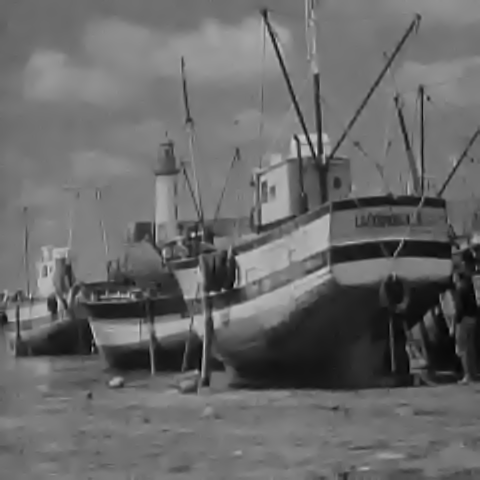
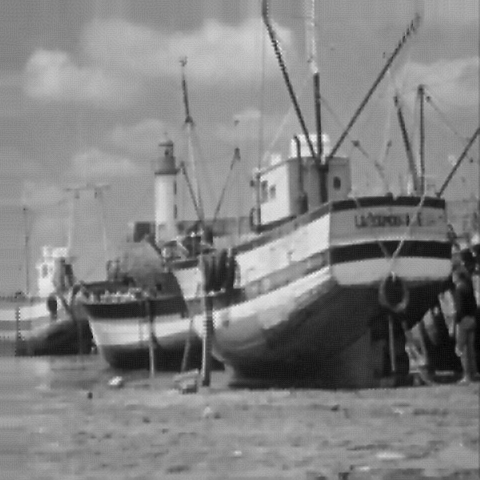
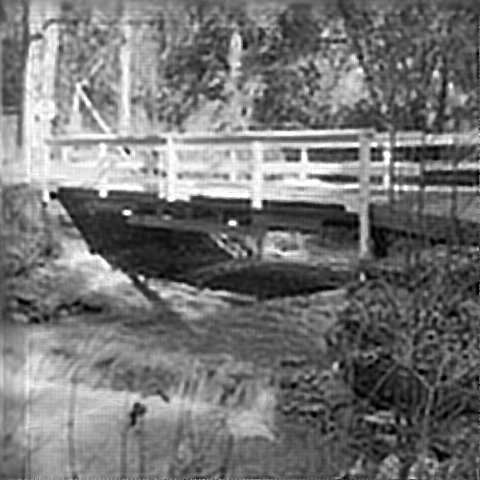
| (a) Low-resolution video -- move cursor over and click to see | (b) TF Model [1] | (c) MAP Model [3] |
|
|
|
| (d) SDR Model [2] | (e) Our Nuclear Model [5] | (f) True high-resolution image |
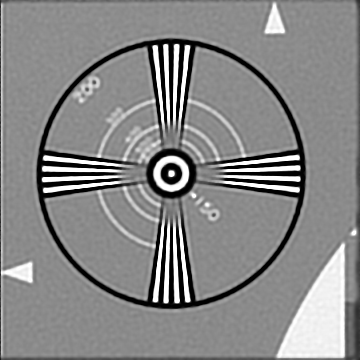
| Comparison of different algorithms on ``Boat'' image with upsampling factor r=2. (a) The low-resolution video. (b) Result of the TF model. (c) Result of the MAP model. (d) Result of the SDR model. (e) Result of our nuclear model. (f) True high-resolution image. | ||
 |
 |
 |
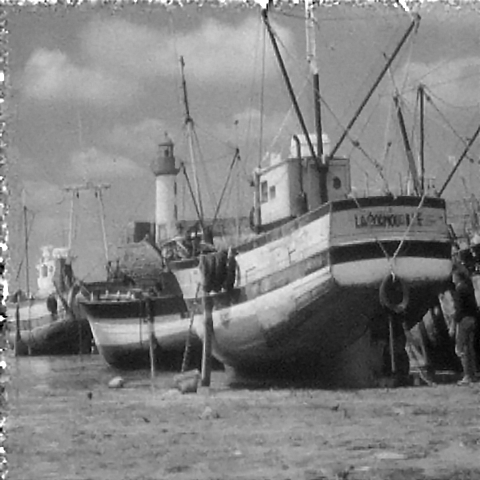
| (a) Reference low-resolution image | (b) TF Model [1] | (c) MAP Model [3] |
 |
 |
|
| (d) SDR Model [2] | (e) Our Nuclear Model [5] | (f) True high-resolution image |
| Zoomed in comparison of different algorithms on ``Boat'' image with upsampling factor r=2. (a) The reference low-resolution image. (b) Result of the TF model. (c) Result of the MAP model. (d) Result of the SDR model. (e) Result of our nuclear model. (f) True high-resolution image. | ||
 |
 |
|
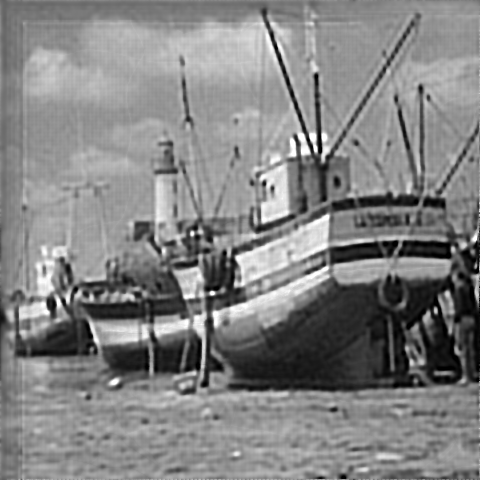
| (a) Low-resolution video -- move cursor over and click to see | (b) TF Model [1] | (c) MAP Model [3] |
 |
 |
|
| (d) SDR Model [2] | (e) Our Nuclear Model [5] | (f) True high-resolution image |
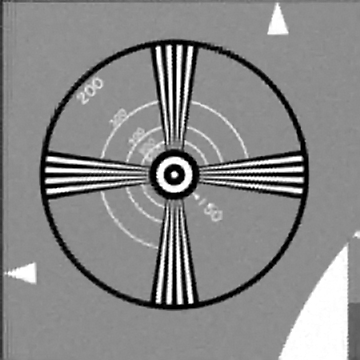
| Comparison of different algorithms on ``Boat'' image with upsampling factor r=4. (a) The low-resolution video. (b) Result of the TF model. (c) Result of the MAP model. (d) Result of the SDR model. (e) Result of our nuclear model. (f) True high-resolution image. | ||
|
 |
 |
| (a) Reference low-resolution image | (b) TF Model [1] | (c) MAP Model [3] |
 |
 |
|
| (d) SDR Model [2] | (e) Our Nuclear Model [5] | (f) True high-resolution image |
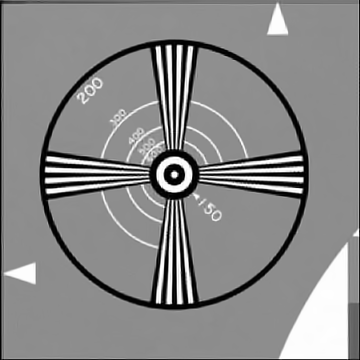
| Zoomed in Comparison of different algorithms on ``Boat'' image with upsampling factor r=4. (a) The reference low-resolution image. (b) Result of the TF model. (c) Result of the MAP model. (d) Result of the SDR model. (e) Result of our nuclear model. (f) True high-resolution image. | ||
 |
 |
|
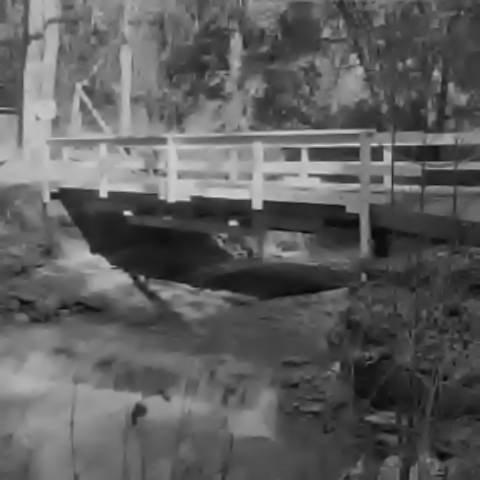
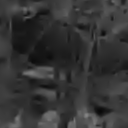
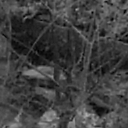
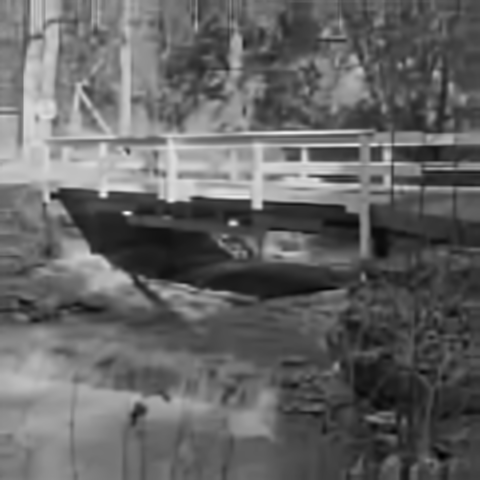
| (a) Low-resolution video -- move cursor over and click to see | (b) TF Model [1] | (c) MAP Model [3] |
 |
 |
|
| (d) SDR Model [2] | (e) Our Nuclear Model [5] | (f) True high-resolution image |
| Comparison of different algorithms on ``Bridge'' image with upsampling factor r=2. (a) The low-resolution video. (b) Result of the TF model. (c) Result of the MAP model. (d) Result of the SDR model. (e) Result of our nuclear model. (f) True high-resolution image. | ||
 |
 |
 |
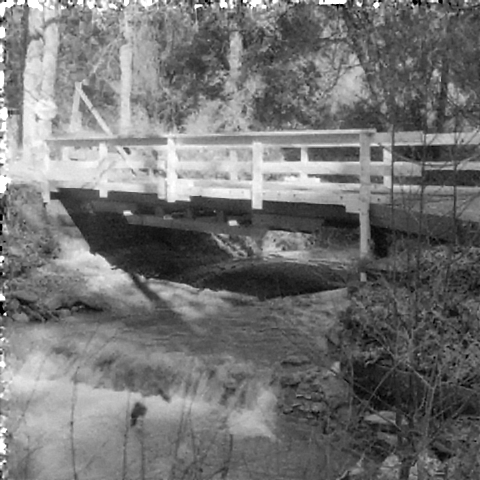
| (a) Reference low-reslution image | (b) TF Model [1] | (c) MAP Model [3] |
 |
 |
|
| (d) SDR Model [2] | (e) Our Nuclear Model [5] | (f) True high-resolution image |
| Zoomed in comparison of different algorithms on ``Bridge'' image with upsampling factor r=2. (a) The reference low-resolution image. (b) Result of the TF model. (c) Result of the MAP model. (d) Result of the SDR model. (e) Result of our nuclear model. (f) True high-resolution image. | ||
 |
 |
|
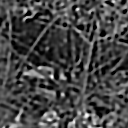
| (a) Low-resolution video -- move cursor over and click to see | (b) TF Model [1] | (c) MAP Model [3] |
 |
 |
|
| (d) SDR Model [3] | (e) Our Nuclear Model [5] | (f) True high-resolution image |
| Comparison of different algorithms on ``Bridge'' image with upsampling factor r=4. (a) The low-resolution video. (b) Result of the TF model. (c) Result of the MAP model. (d) Result of the SDR model. (e) Result of our nuclear model. (f) True high-resolution image. | ||
|
 |
 |
| (a) Reference low-resolution image | (b) TF Model [1] | (c) MAP Model [3] |
 |
 |
|
| (d) SDR Model [2] | (e) Our Nuclear Model [5] | (f) True high-resolution image |
| Zoomed in Comparison of different algorithms on ``Bridge'' image with upsampling factor r=4. (a) The reference low-resolution image. (b) Result of the TF model. (c) Result of the MAP model. (d) Result of the SDR model. (e) Result of our nuclear model. (f) True high-resolution image. | ||
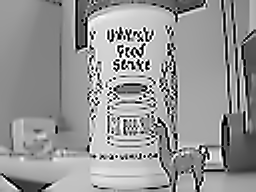
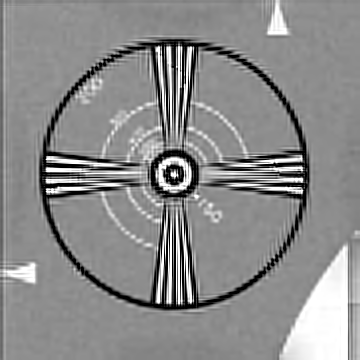
| (a) Text low-resolution video -- move cursor over and click to see (Size 57x49 with 21 frames) (Source File AVI MAT ) | (b) Disk low-resolution video -- move cursor over and click to see (Size 57x49 with 19 frames) (Source File AVI MAT ) | (c) Alpaca low-resolution video -- move cursor over and click to see (Size 96x128 with 21 frames) (Source File AVI MAT ) | (d) Eia low-resolution video -- move cursor over and click to see (Size 90x90 with 16 frames) (Source File AVI MAT ) |
 |
 |
 |
 |
 |
 |
 |
 |
| (a) TF Model [1] | (b) MAP Model [3] | (c) SDR Model [2] | (d) Our Nuclear Model [5] |
| Comparison of different algorithms on "Text Video". Top row with upsampling factor r=2 and second row with upsampling factor r=4. (a) The TF model, (b) The MAP model, (c) The SDR model and (d) Our nuclear model. | |||
 |
 |
 |
 |
 |
 |
 |
 |
| (a) TF Model [1] | (b) MAP Model [3] | (c) SDR Model [2] | (d) Our Nuclear Model [5] |
| Comparison of different algorithms on "Text Video". Top row with upsampling factor r=2 and second row with upsampling factor r=4. (a) The TF model, (b) The MAP model, (c) The SDR model and (d) Our nuclear model. | |||
 |
 |
 |
|
 |
 |
 |
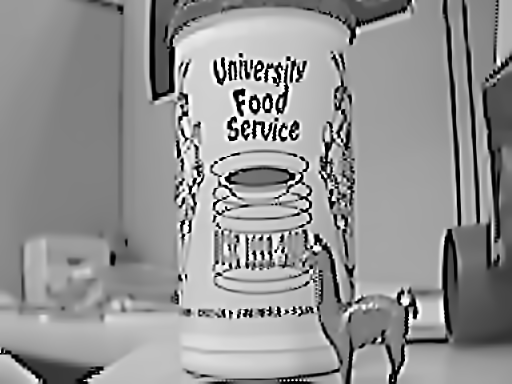 |
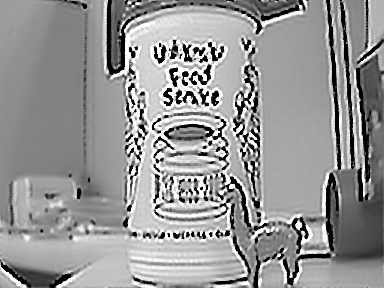
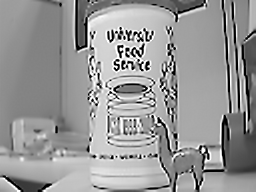
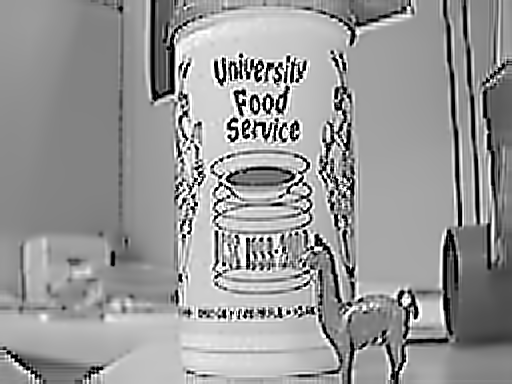
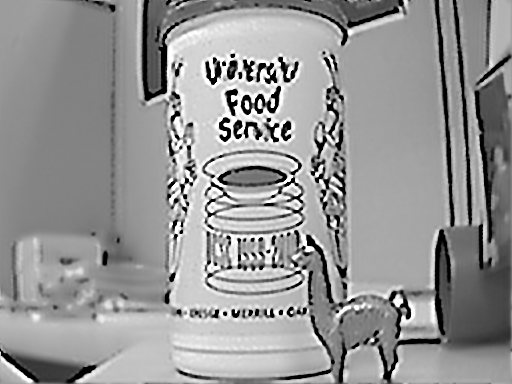
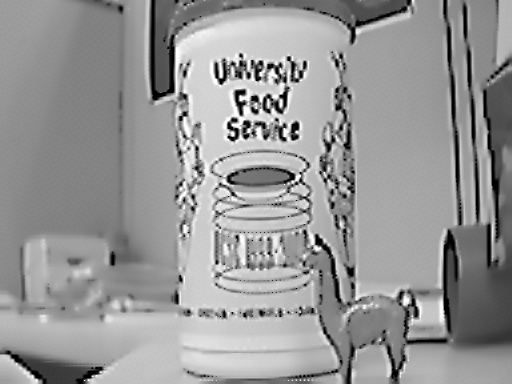
| (a) TF Model [1] | (b) MAP Model [3] | (c) SDR Model [2] | (d) Our Nuclear Model [5] |
| Comparison of different algorithms on "Alpaca Video". Top row with upsampling factor r=2 and second row with upsampling factor r=4. (a) The TF model, (b) The MAP model, (c) The SDR model and (d) Our nuclear model. | |||
 |
 |
||
| (a) TF Model [1] | (b) MAP Model [3] | ||
 |
 |
||
| (c) SDR Model [2] | (d) Our Nuclear Model [5] | ||
| Comparison of different algorithms on "Eia Video". (a) The TF model, (b) The MAP model, (c) The SDR model and (d) Our nuclear model. | |||
 |
 |
||
| (a) The low-resolution video -- move cursor over and click to see (Source File MPG ) | (b) TF Model [1] | (c) MAP Model [3] | |
 |
 |
||
| (d) SDR Model [2] | (e) Our Nuclear Model [5] | ||
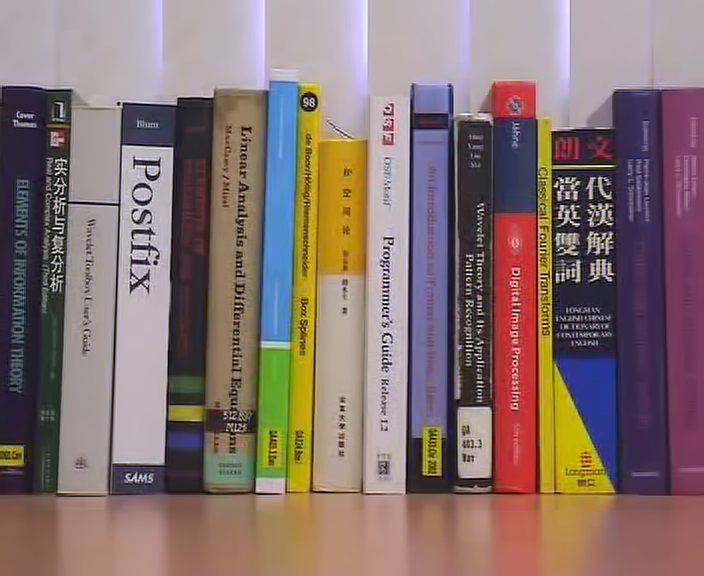
| The "Books Video" and comparison of different algorithms on the "Books Video". (a) The low-resolution video, (b) The TF model, (c) The MAP model, (d) The SDR model and (e) Our nuclear model. | |||
 |
 |
 |
|
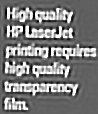
| (b) TF Model [1] | (c) MAP Model [3] | ||
 |
 |
 |
|
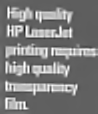
| (a) Low-resolution image | (d) SDR Model [2] | (e) Our Nuclear Model [5] | |
| The first zoomed-in comparison of different algorithms on the "Books Video". (a) The low-resolution image, (b) The TF model, (c) The MAP model, (d) The SDR model and (e) Our nuclear model. | |||
 |
 |
 |
|
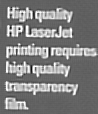
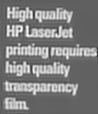
| (b) TF Model [1] | (c) MAP Model [3] | ||
 |
 |
 |
|
| (a) Low-resolution image | (d) SDR Model [2] | (e) Our Nuclear Model [5] | |
| The second zoomed-in comparison of different algorithms on the "Books Video". (a) The low-resolution image, (b) The TF model, (c) The MAP model, (d) The SDR model and (e) Our nuclear model. | |||